If you want to sell successfully on Merch by Amazon, you need more than gut instinct - you need data. The MerchIntel Dashboard is your command center for MBA market intelligence, giving you a real-time pulse on what is happening across the entire marketplace. Whether you are just getting started or scaling up your design operation, the Dashboard helps you make smarter decisions faster. This guide walks you through each section and shows you exactly how to use it to your advantage.
Market Overview at a Glance
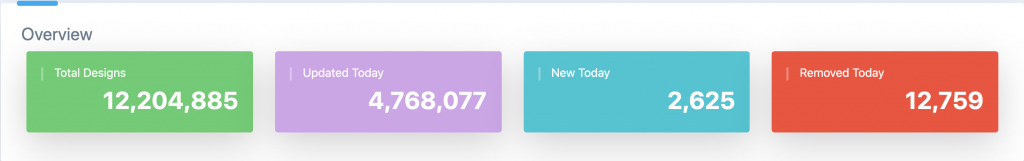
The Overview section gives you four core metrics that tell the story of the entire MBA marketplace at any given moment. Understanding each one helps you time your uploads, spot opportunity gaps, and avoid costly mistakes.
Total Design: This is the total number of active designs on Merch by Amazon, updated hourly. The marketplace has now crossed 300 million designs - a figure that highlights just how competitive MBA has become. Knowing this number helps you appreciate why niche targeting and keyword precision matter so much. The blue ocean days of broad, generic designs are long gone.
Updated Today: This counts designs whose key indexes - such as BSR or price - changed in the last 24 hours. A high number here signals an active, shifting market. If you see a large spike, it often means Amazon ran a pricing event or a seasonal trend is picking up momentum. Pay attention to this number before launching a new niche campaign.
New Today: The count of brand-new products listed today. This is your competition intelligence metric. If you are about to upload a design in a trending niche and you see thousands of new listings that morning, you know competition is heating up fast. Use this to decide whether to push ahead quickly or pivot to a less saturated angle.
Delete Today: The number of products removed from Amazon today. Designs get deleted for several reasons - no sales within 90 or 180 days, copyright infringement, or content policy violations. MerchIntel saves all deleted designs in its database so you can study them and learn from others' mistakes. This is especially valuable because accounts with four to five deleted designs face a significantly higher risk of permanent suspension. Knowing what gets removed helps you stay compliant and competitive.
Best Sellers Rank: Understanding Market Competition
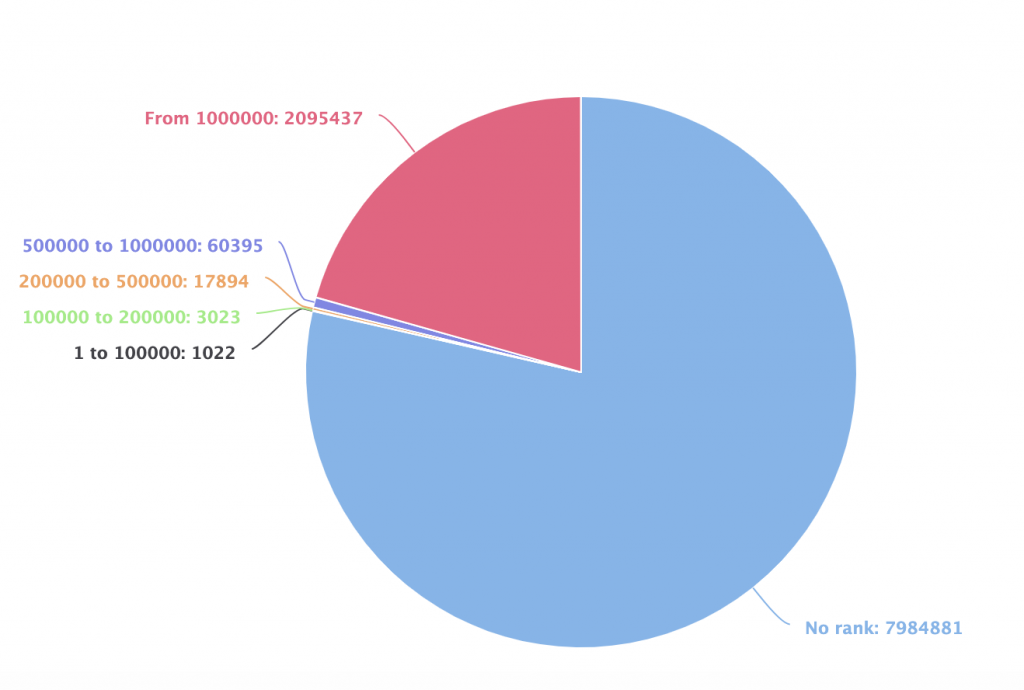
The Best Sellers Rank chart breaks down the MBA marketplace into rank tiers and shows how many products are selling within each tier. This pie chart is one of the most underutilized tools for MBA sellers - and one of the most powerful.
Here is the practical insight: the BSR chart shows you where the competition is densest and where breathing room still exists. Most new sellers chase the top BSR ranges because they assume that is where all the money is. But the chart often reveals that mid-tier rank ranges have a strong volume of sold products with far fewer competitors fighting for that space.
A real use case: imagine you are deciding between two niches. Niche A has products ranking in the top 10,000 BSR but is flooded with thousands of designs all competing head-to-head. Niche B has products ranking around 50,000-150,000 BSR with a fraction of the competition. The BSR chart helps you spot that Niche B may actually be the smarter bet - consistent sales with less noise.
Pro tip: check this chart weekly and note how the distribution shifts. When a tier suddenly gains a larger share of sold products, it signals a trending category worth investigating through the Merch Research tool.
Top Keywords: Spot Trending Niches Instantly
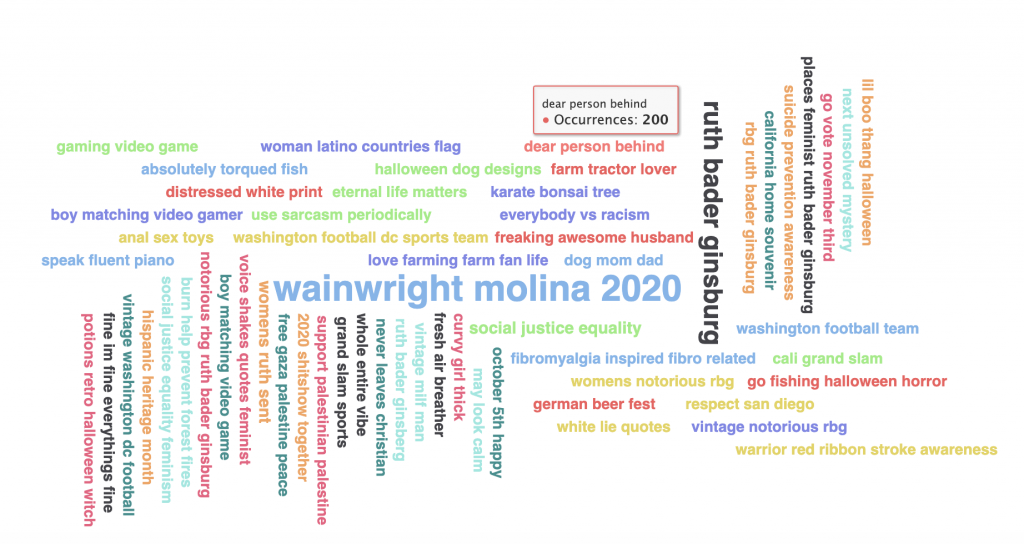
The Top Keywords section displays a keyword cloud pulled from the most frequently used search terms across active MBA listings. The larger the keyword appears in the cloud, the more often it shows up in listings - giving you an instant visual read on what buyers are searching for right now.
This feature is powerful for two reasons. First, it surfaces trending niches without requiring you to guess or do manual searches. Second, it is updated regularly, so seasonal and event-driven trends appear before they peak. Spotting "back to school" or "dog mom" climbing the cloud in early summer gives you lead time to create designs before the surge.
How to use it effectively: hover over any keyword to see its frequency count. Then click it - MerchIntel will take you directly to the Merch Research page filtered for that keyword, showing you all the products currently ranking for it. You can immediately assess design quality, pricing, and BSR distribution in that niche.
Pro tip: screenshot the keyword cloud on Monday mornings and compare it week over week. Keywords that grow quickly in size are your early-mover opportunities. Combine these insights with the MerchIntel keyword research tool for deeper analysis before committing to a new niche.
New Designs Per Day: Track Market Activity
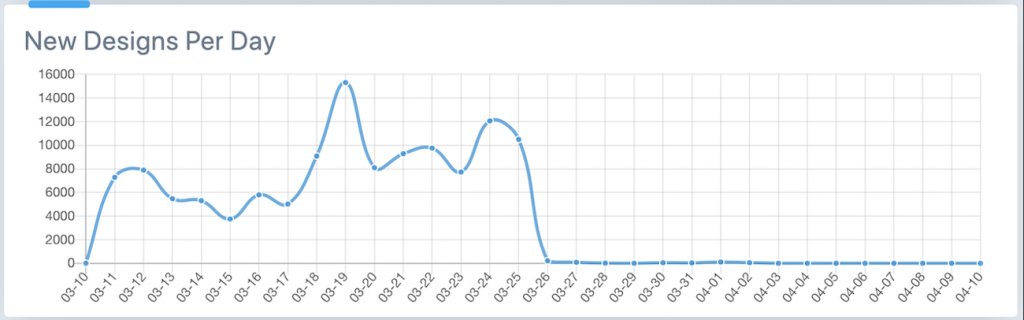
The New Designs Per Day chart shows daily and monthly fluctuations in how many new products are being uploaded to Merch by Amazon. Think of it as the market's heartbeat - and learning to read it can tell you a lot about where the market is heading.
What do the spikes and dips mean for you as a seller? A sudden spike in new designs often indicates a trending event or seasonal moment that other sellers are rushing to capitalize on - think holidays, major sports seasons, or viral pop culture moments. If you see a spike and you have not uploaded yet, move quickly. If you wait until the spike has already happened, you are late to the party.
A sharp dip, on the other hand, can signal a platform-wide disruption. A well-known example was March 28, 2020, when Amazon temporarily shut down its US print center. The chart showed an immediate and dramatic drop in new US listings, while UK and DE markets continued operating normally. Sellers who tracked this data knew not to panic - it was an operational pause, not a market collapse. When the US center reopened, activity rebounded sharply.
This chart is also useful for identifying slower upload periods - times when fewer sellers are active. These windows can be smart moments to upload in competitive niches, since your new designs face less immediate competition for visibility in the new arrivals queue.
MerchIntel updates this chart continuously, so the data you see reflects real market conditions as they unfold - not reports from days ago.
Pro Tips for Using the Dashboard
Getting the most from the Dashboard means building it into your regular workflow, not just checking it occasionally. Here is a daily routine that experienced MBA sellers use:
Morning check (5 minutes): Open the Dashboard first thing and scan the four overview metrics. Note any unusual spikes in new listings or deletions. Check the keyword cloud for anything that has grown since yesterday.
Weekly BSR review: Every Monday, spend ten minutes studying the BSR distribution chart. Record how the tier percentages have shifted. If a mid-tier range has grown its share of sold products, add it to your research list.
Keyword-to-research workflow: When a keyword in the cloud catches your attention, do not just note it - click it immediately and review the active designs. This takes you from dashboard observation to actionable research in under a minute. From there, dive deeper with the Merch Research tool to analyze the full competitive landscape.
Trend timing: Use the New Designs Per Day chart alongside seasonal planning. If you know a holiday is six weeks out and you see upload volume starting to climb, that is your signal to finalize and upload your seasonal designs now - not next week.
Cross-referencing deletions: When the Delete Today number is unusually high, browse the deleted designs in MerchIntel's archive. Look for patterns - are specific niches getting cleared out? Is a particular design style being flagged? This intelligence helps you avoid stepping into the same traps.
Key Takeaways
- The Dashboard gives you a real-time market snapshot across four critical metrics: total designs, updated today, new today, and deleted today
- The BSR chart helps you identify competitive sweet spots - rank ranges with solid sales volume but lower competition density
- The Top Keywords cloud surfaces trending niches before they peak, giving you time to create and upload early
- The New Designs Per Day chart reads market momentum - use spikes as urgency signals and dips as strategic upload windows
- Building a daily five-minute dashboard check into your routine puts you consistently ahead of sellers who rely on guesswork
Ready to see the full MerchIntel Dashboard in action? Start your 14-day free trial and get access to real-time MBA market data, 300M+ designs, and hourly updates - everything you need to research smarter and sell more.
